Ethnicity
Greenwich is a diverse borough; people living in Greenwich are from a wide range of ethnicities and backgrounds, and there are over 90 languages spoken. 19% of households do not speak English as a first language.
In 2017 just over half (59%) of Greenwich's population was of white ethnicity, a quarter (24%) black (African or Caribbean), a fifth Asian (14%) or other (3%) ethnicities.
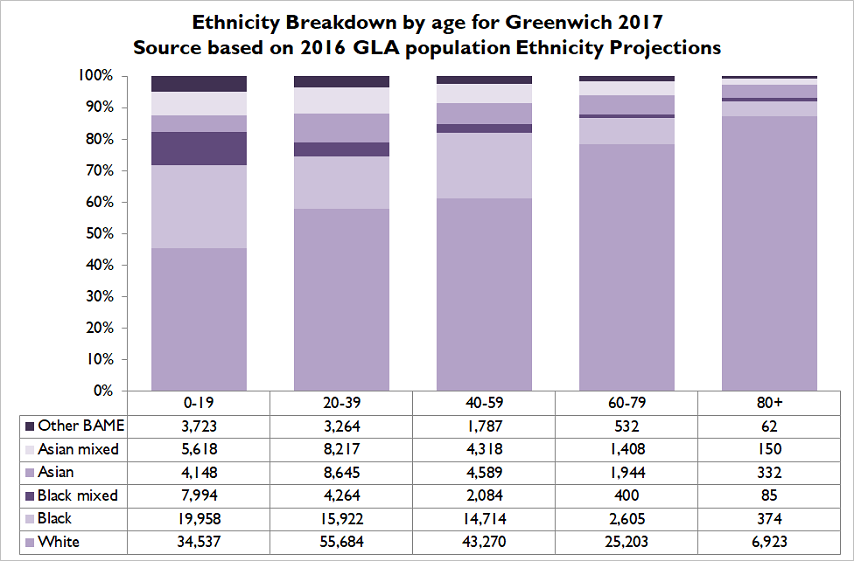
Source: GLA
The ethnic diversity of Greenwich varies across the age bands; the 0-19 age group are the most diverse group in the population. The least diverse age groups are those aged 60 years and above, with 80% being from a white ethnicity (which is more in line with the national picture).
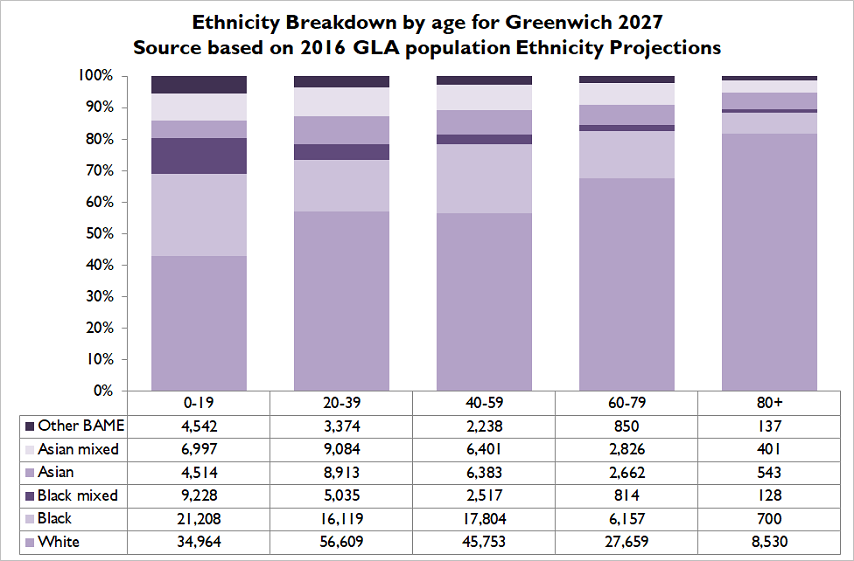
The population of Greenwich is estimated to become more diverse by 2027 with age bands following their current trends.
Source: GLA
Greenwich Race Equality Scorecard
The Greenwich Race Equality Scorecard report, produced in partnership with the Runnymede Trust and Greenwich Inclusion Project, explores the challenges facing ethnic minority groups in our borough. Findings include:
- racist hate crime has been on the rise in Greenwich in the past few years
- black and minority ethnic (BME) pupils outperform their white counterparts in Greenwich schools, however BME residents face worse outcomes on the labour market
- Use of force by the police disproportionately targets black people in Greenwich
- Black people were on average 3.2 times more likely to be statutory homeless than their white counterparts in Greenwich