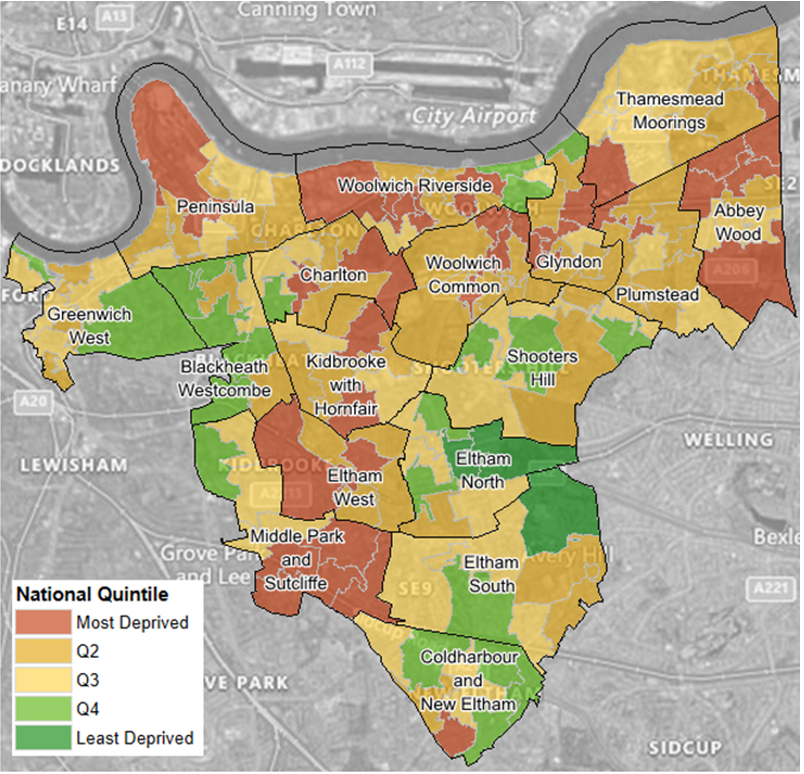
Indices of deprivation
The Indices of Deprivation provides a place-based insight into deprivation.
The Indices of Deprivation 2019 (IoD 2019) also known collectively as the Index of Multiple Deprivation (IMD 2019) is the measure of relative deprivation, which includes a wide range of indicators evaluating living conditions across England.
It is important to note that deprivation differs from poverty. An individual can be considered to be living in poverty if they lack the financial resources to meet their needs. An individual can be regarded as deprived if they lack a broader range of resources, not just income. For example, access to employment, access to services, and local living conditions.
The IoD 2019 measures deprivation on a relative (ranked) rather than an absolute scale, so a Lower Super Output Area (LSOA) or "neighbourhood" ranked 100th is more deprived then a neighbourhood ranked 200th, but this does not mean it is twice as deprived.
The IoD 2019 provides a place-based measure of deprivation. However, it is important to recognise that where deprivation is seen in a particular place, it does not necessarily apply to every individual living within that area.
Three key measures are used to assess levels of deprivation at a local authority level.
As patterns of deprivation at a local authority level are complex, there is no single measure that 'best' measures deprivation. Instead, three main measures are used in conjunction with each other:
Average Rank: this measure summarises the average level of deprivation across a local authority, based on weighted ranks of all the neighbourhoods within it. Overall, local authorities that have both highly deprived and more wealthy communities will tend to average out in the overall rank. In contrast, local authorities that are more consistently deprived across the area will tend to rank higher i.e. more deprived.
Average Score: this measure summarises the average level of deprivation across a local authority, based on the scores of all the neighbourhoods contained within it.
Proportion of LSOAs in the most deprived 10% (deciles) or most deprived 20% (quintiles) nationally: this measure summarises the proportion of LSOAs or neighbourhoods in a local authority that are in the most deprived 10% (or 20%) of neighbourhoods in England.
Source: Ministry of Housing, Communities & Local Government The English Indices of Deprivation 2019 (IoD 2019)
While Greenwich has seen an improvement in its ranking compared to other local authorities in England, the borough remains one of the most deprived in the country.
Greenwich is in the bottom most deprived quarter of all local authorities in England for the average rank but appear slightly less deprived for the average score measures, being within the bottom 50% all local authorities.
The borough has had a marked improvement using the rank of LSOAs (neighbourhoods) in the most deprived 10% areas in England moving from 173 in 2015 to 191 in 2019 (out of 315).
It is important to understand that the IoD measures relative deprivation. While the ranking of Greenwich as a whole compared to other local authorities may have improved (from rank 60 to 70 out of 315), this does not necessarily indicate that absolute levels of deprivation in the borough have reduced.