How have we changed in Greenwich?
Greenwich's population today very much reflects its past and understanding this and the changing population structure over time can aid policy development and inform the commissioning of services and delivery.
Greenwich's population has changed hugely over the last century. While the overall population of Greenwich fell between 1939 and 1991, it has grown by over 25% in the two decades up to the last census in 2011. The population is projected to continue grow over the coming decades, increasing by 39,000 in the ten years to 2021, reaching 294,500.
The population pyramids show the profile of the population in Greenwich in 1961, 1981 and 2001. The following changes have been observed:
- Children and young people (0-24 years): a 10% decrease between 1961 and 2001. Highest decrease in 10-19 year olds (-29% in 10-14 year olds, -23% in 15-19 year olds)
- Younger working aged adults (25-49 years): largest increase in 25-29 year olds (37% in males, 59% in females) and 30-34 year olds (44% in males, 47% in females) between 1961 and 2001. However, there is an overall decrease in 45-49 year olds to 2001 despite a large increase (15-20%) between 1961 and 1981 in this age group
- Older working aged adults (50-74 years): between 1961 and 2001 there has been continual decline with an average of 25% for males and 30% decrease for females.
- Older people (75 and over): 1961 and 2001 increased, but the 85 years and over saw 100% increase in men and over 135% increase in women reflecting the increasing life expectancy over the same time period
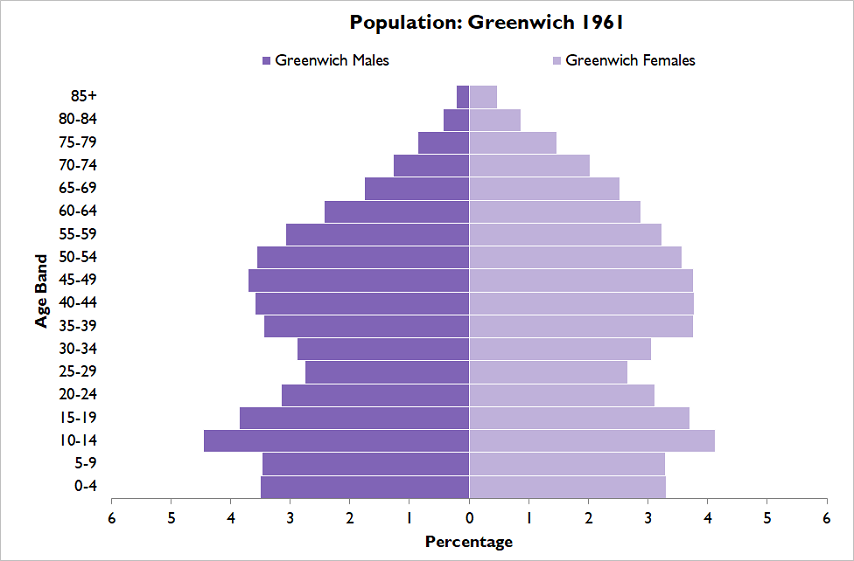
Source: ONS
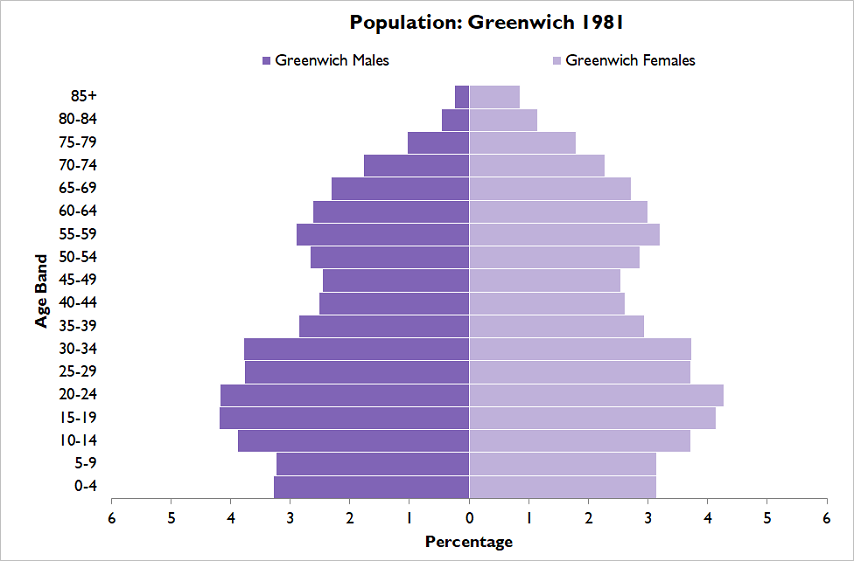
Source: ONS
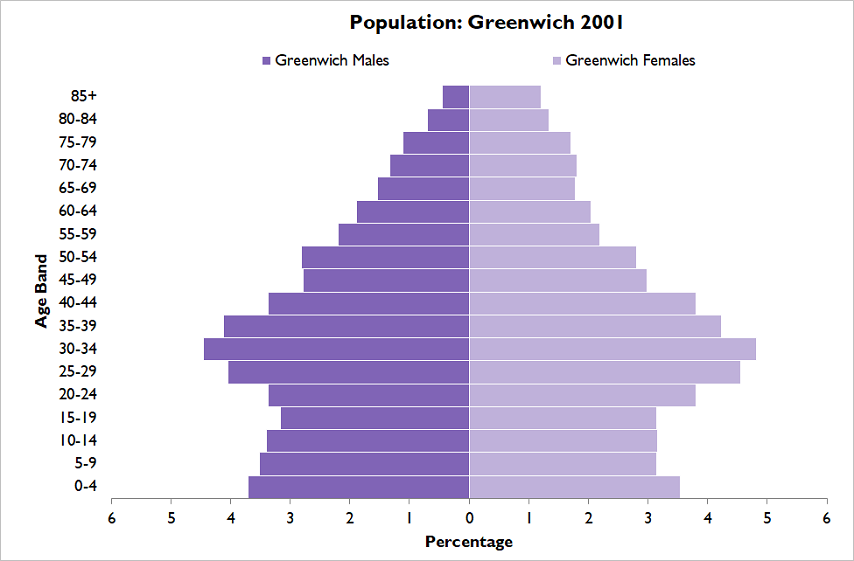
Source: ONS