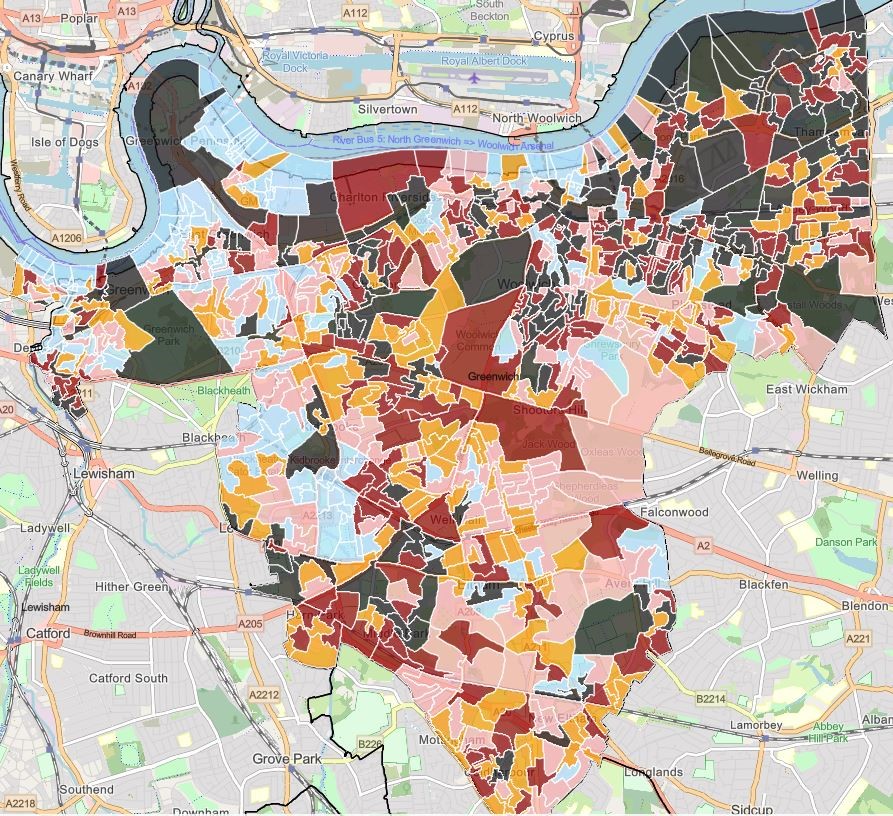
The gambling vulnerability index is a tool that shows where in the borough gambling problems may be more common because of certain risk factors.
For example, someone who is in debt or has a history of drug problems may be more vulnerable in an area which has access to gambling.
This data was last updated in November 2024.
If you have any questions, email licensing@royalgreenwich.gov.uk.
How we calculate the scores
The scores are calculated by looking at different risk factors in small areas called Lower Super Output Areas (LSOAs). Places where people can bet were not included in these risk factors.
The scores are split into 5 parts, called quintiles. Each quintile represents 20% of the data:
-
Quintile 1 (black) - this group includes the highest 20% of scores.
-
Quintile 2 (dark red) - this group includes scores that are slightly lower, but still in the top 40%.
-
Quintile 3 (yellow) - this group is in the middle and includes scores between 40% and 60%.
-
Quintile 4 (light pink) - this group includes scores that are lower than the middle but above the bottom 20%.
-
Quintile 5 (light blue) - this group includes the lowest 20% of scores.
We then used these quintiles to create a map of Greenwich, showing different colours for each area based on their quintile scores.
| LSOA 21 | Weighted vulnerability score |
| E01001571 | 1.23 |
| E01001572 | 0.97 |
| E01001573 | 1.52 |
| E01001574 | 1.27 |
| E01001575 | 1.59 |

Types of area
- Output areas (OAs) have around 310 people living in it, but there is limited data available for these.
- Lower layer super output areas (LSOAs) have around 1,500 people living in it, or 650 households.
- Middle layer super output areas (MSOAs) have around 7,500 people living in it, or 4,000 households.
Read OCSI's guidance on statistical geographies.
Sources
- Metropolitan Police Service
- Corporate GIS (Royal Greenwich)
- Census 2021
- NHS
- Public Health (Royal Greenwich)
- Children's Services (Royal Greenwich)
- Housing Services (Royal Greenwich)